The Chainlink price analysis is bullish for today, as the coin’s price has increased to $21.8 after constant bullish efforts. The bulls are in the lead for the third day as the coin rejected further downside below $19.4 on 5th December
- Bitcoin Sees Profit Spike as Ether, Other Altcoins Record Losses: All Details
- BTC Opens at $16,570, ETH Joins Stablecoins in Recording Losses: First Monday of 2023
- BTC, ETH Show No Price Hikes Despite Christmas, Most Altcoins See Small Gains
Earlier to this, LINK observed high losses as the price trend was downwards since 12th November when the coin started its downward journey from $34.7, losing a good chunk of value. There were bullish periods in between the downslide but on a smaller scale. However, the recent bullish episode is comparatively better, as relatively more recovery has been made by bulls this time as compared to the earlier tries.
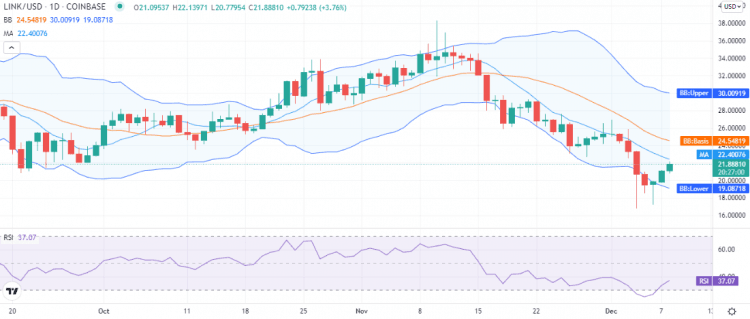
LINK/USD 1-day price chart: Bullish momentum to encounter $22 resistance
The 1-day price chart for Chainlink price analysis shows the price has increased today, as the cryptocurrency is trading hands at $21.8 at the time of writing. The LINK/USD reports an increase in price value by 8.41 percent over the last 24 hours, but on the contrary, shows a deficit in price value by 23.08 percent over the past week as the trend was downwards during the early days. The trading volume has also dipped by 11.90 percent, but the market cap improved by 3.52 percent in the last 24 hours.

The volatility is high as the Bollinger bands are expanded, with their average line forming at $24, representing resistance for LINK. The expansion between the Bollinger bands has resulted in its upper value reaching the $30 level and the lower value reaching the $19 level representing support for LINK. Lastly, the Relative Strength Index (RSI) score has also improved as the bullish momentum has been continuous, as it has climbed past the border of the oversold region and is now trading at index 37.
Chainlink price analysis: Recent developments and further technical indications
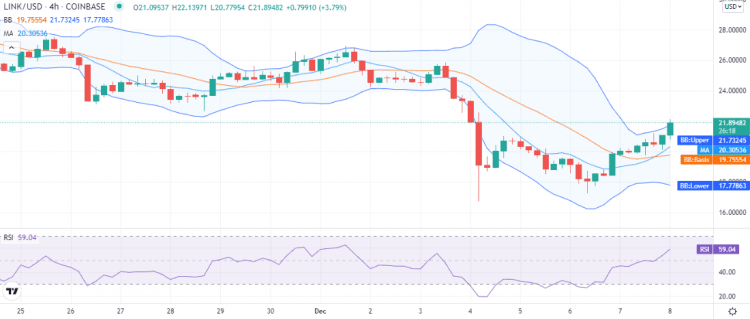
The 4-hour price chart for Chainlink price analysis shows the price function started upside again during the last hours of yesterday’s trading session after a correction for a few hours and have oscillated fast in the first four hours of today’s trading session. The bullish momentum has been healthy today as the price has moved past the upper limit of the volatility indicator.

The volatility is increasing again on the 4-hour chart, as the Bollinger bands, after converging steeply, have started to expand again, with the upper band reaching $21.7, which represents support for the coin, and the lower band has reached $17.7 with their mean average line at $19.7. The moving average (MA) is present above the Bollinger bands average at the $20.3 mark. The RSI on the 4-hour chart is trading on an upwards slope indicating the buying activity in the market. The RSI is present in the upper half of the neutral zone at index 59.
Chainlink price analysis conclusion
The Chainlink price analysis shows bullish momentum is in good form, and the price is recovering well. It looks like bulls will breakthrough above the $22 resistance as the buying activity is also considerable, as the RSI curve indicates. If the Bullish momentum continues, LINK can break near $23 later today to restest the $23.3 resistance in the next trading session.


